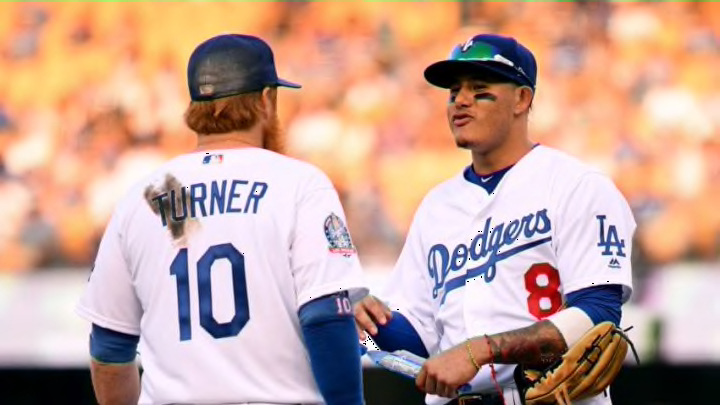
By May there were questions. The Dodgers were struggling to keep pace with the bottom of the NL West let alone the division leader. The team’s number hovered around the bottom, leaving players and fans hoping for a change. But as the spring turned to summer, the Dodgers found their footing, put a charge behind each baseball and powered their way back to the top of the NL West for the sixth straight season.
After opening the year just 26-36, the Dodgers lead the NL in win percentage with a record of 76-45 (.628) and finished the season with the second most homers in the Majors. The Dodgers also finished the season with a Pythagorean record of 102-61, good for the best record in the National League.
But, finishing the regular season strong is only good for winning a division. Now, the Dodgers find themselves in Fenway Park, waiting to face a Red Sox team that has dominated baseball all season. The Dodgers are considered the underdogs by everyone but, in order to get the best look at how this series may shake out, let’s zoom out and compare the teams to each other by the numbers, and see how each team stacks up.
Power wins baseball games in this era. While home runs are incredibly inefficient, teams have become fairly reliant on the long ball to win them a game; we saw this in Milwaukee during game seven.
Well, during the regular season the Dodgers slugged baseballs out of the park like it was nobody’s business. Los Angeles finished second in the league in homers, only behind the Yankees and hit 27 more home runs than the Red Sox did in the same span. Want to get more recent? The Dodgers are ranked second in postseason homers with 13, trailing the Astros by just one. The Sox come into the Fall Classic with nine homers, perhaps hinting at a slight power advantage in favor of the Boys in Blue.
But, as fun as a home run is, the statistic is inefficient. Home runs score runs but take runners off the bases. To zoom the production out a bit we can look at runs. In the postseason, the Sox have scored 56 runs in just nine games, that’s ridiculous. But the monstrosity of a number may not be as impressive as the eye can see when you remember that Boston put up 16 in one game against the Yankees. If you factor out the 16 they scored and replace it with the average runs they scored per game, five, the Red Sox have put up 45 runs during the playoffs. The Dodgers have scored 43.
The strength of the batting for each team has been the major factor to make the Sox the heavy favorite to win the series. Boston’s lineup has been lights out all season from batters one through nine but the difference in wins above replacement may shock you. During the regular season, LA accumulated a 33.0 WAR, tops in all of baseball. Boston’s WAR, while still very high, was 29.6. Their score was significantly lower than the Dodger but good for third in baseball.
More from Dodgers Way
- Are the Dodgers really prepared to hand Shohei Ohtani a blank check?
- Dodgers fans shouldn’t dismiss interest in Dansby Swanson for this reason
- Giants laughably sign pitcher that Dodgers absolutely own
- Dave Roberts’ quote about Padres in NLDS should motivate Dodgers
- Dodgers might find their next Tyler Anderson with this free agent target
The Dodgers also lead Boston in ISO, wRC+ and wGDP, a statistic we will spend some time on right now.
wGDP is the measuring stick for hitting into double plays. You look at that and wonder when on earth that serves as a massive advantage for the Dodgers, I’ll tell you. When a player produces and out, it’s never good. One out is harmful and two is deadly. So, wGDP measures how often, with a runner on first, a team hits into a double play. Zero is considered average.
The Dodgers finished the season with a mark of -.7, it’s not great, it’s below average and they could certainly do a lot better. But, Boston finished the season in the same group as the Orioles, Pirates, Padres and Royals- way at the bottom of the league. Boston’s final number was -5.1. Fangraphs deems -2.5 awful, the Sox doubled that.
The issue with that stat, however, is Boston kills the Dodgers in getting runners on base which gives them more opportunities to ground into double plays. Boston leads the Major Leagues in on-base-percentage, batting average, slugging percentage, wOBA and came in second in BABIP (Cubs were first).
The Dodgers will need to keep those numbers at bay and will rely heavily on the starting rotation, comprised mostly of lefties, to dominate a lineup that oddly struggles against lefties. Read about that in the article linked here.
Boston is the offensive favorite for sure. But, they do not dominate the Dodgers like people may have previously predicted and they certainly will have to compete to win a series, just like the Dodgers will. Do I think the numbers make the Dodgers the favorites to win it all, no. But, do I think these numbers suggest anything is truly possible and this may not be over before it even started, absolutely.
