Dodgers: The Kershaw Question: Just How Different Is He?

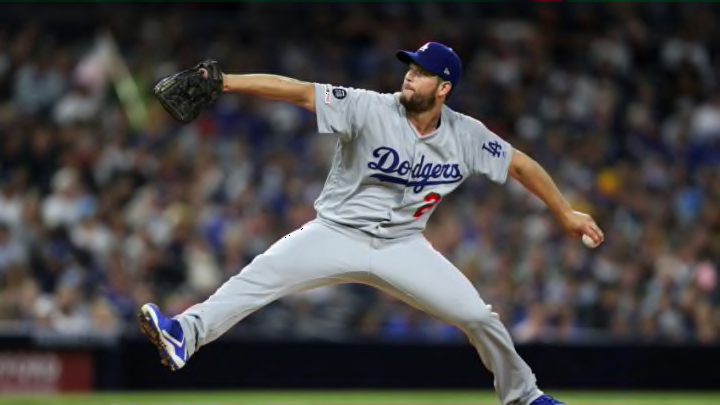
SAN DIEGO, CALIFORNIA - MAY 03: Clayton Kershaw #22 of the Los Angeles Dodgers pitches during the third inning of a game against the San Diego Padres at PETCO Park on May 03, 2019 in San Diego, California. (Photo by Sean M. Haffey/Getty Images)
3 of 4
Next
SAN DIEGO, CALIFORNIA – MAY 03: Clayton Kershaw #22 of the Los Angeles Dodgers pitches during the third inning of a game against the San Diego Padres at PETCO Park on May 03, 2019 in San Diego, California. (Photo by Sean M. Haffey/Getty Images)
SAN DIEGO, CALIFORNIA – MAY 03: Clayton Kershaw #22 of the Los Angeles Dodgers pitches during the third inning of a game against the San Diego Padres at PETCO Park on May 03, 2019 in San Diego, California. (Photo by Sean M. Haffey/Getty Images) /

The Dodgers entered the season with questions about Clayton Kershaw.  How good would he be in 2019?

It’s 2019, and Clayton Kershaw is no longer the best pitcher in baseball for the Dodgers. He is no longer feared by opponents to the same degree, or unanimously considered the best pitcher on the planet as he was dubbed only just a few seasons ago.

In fact, the big lefty from Texas still has a lot of what made him great in the first place, just not his 94 mph fastball. Anyone who has seen a Kershaw start this season is bound to have noticed how Kershaw’s fastball velocity and overall usage of his four-seamer has dipped even below his 2018 numbers.

Dodger fans following the team in 2019 have begun to notice the conflicting narratives emerging as everyone struggles to figure out how to cover the aging star. Kershaw is much better on extra rest, or Kershaw has been usurped by Ryu ace the Dodgers’ ace.

Personally, Kershaw’s name still carries the weight it once did. His presence on the mound at Dodger Stadium still means sell out crowds, and more often than not still means a win for the Dodgers. The former NL MVP still holds onto a 2.85 ERA and sterling 7–1 record in his 79 innings of work in 2019 of course.

But the question remains, how has he done it, and even how has he done in general? Has he really been able to put up “Kershawesque” numbers, and what are the indicators of how he will perform for the rest of the season, and maybe for the remainder of this post-prime era of the 30-year old face of the franchise?

In this article, I’ll begin to get into these questions, mostly by taking a look down into the deep well of statistics surrounding the oft-discussed living legend. I’ll do my best to split up Kershaw into three distinct versions, the 2009-2011/2012 version, the 2012/2013-2016 version, and the 2017-2019 version.

To demonstrate how he has changed over time (The 2011 and 2012 seasons marked his entrance into the best in baseball discussion and the first of his NL Cy Young awards, hence the cutoff point and 2017 marked the beginning of decreased regular season and increased postseason workloads).

LOS ANGELES, CA – JUNE 18: Clayton Kershaw #22 of the Los Angeles Dodgers poitches to the San Francisco Giants in the first inning at Dodger Stadium on June 18, 2019 in Los Angeles, California. (Photo by John McCoy/Getty Images)
LOS ANGELES, CA – JUNE 18: Clayton Kershaw #22 of the Los Angeles Dodgers poitches to the San Francisco Giants in the first inning at Dodger Stadium on June 18, 2019 in Los Angeles, California. (Photo by John McCoy/Getty Images) /

Batted Ball Data

Let’s begin with the batted ball data. Kershaw is well known for allowing little hard contact and for generating plenty of strikeouts, at least in his prime. The current version of Kershaw is not much like the prime version though, so let’s compare the old with the new, ala any good infomercial.

DISCLAIMER: What may alter some of the contextual data so drastically despite similar raw numbers, meaning his rank on leaderboards for these various statistics, is the fact that fewer pitchers qualify as “qualified starters” during the 2017-2019 stretch since fewer starters throw enough innings to qualify in comparison to the other sections of Kershaw’s career.

Additionally, the pitching landscape has gone apparently from aiming for groundballs to aiming for flyballs, as pitchers have shown they are willing to play into the hitters’ newfound desire to elevate the baseball. 

In comparing groundball, flyball, and line drive rates, the old and new versions look a lot alike. In his first three seasons with a major workload, and solid results (2009-2011) Kershaw’s groundball rate settled in at 41.1% (good for 88th overall amongst qualifiers), sandwiching him between Homer Bailey (yikes) and Kyle Davies (remember him?), both of whom had ERAs well over 4.00 over this three-season span.

From 2012 to 2016, Kershaw’s groundball rate spiked to 48.6% over four of his best seasons, placing him 50th amongst qualified starters over that time span. His 48.5% mark from 2017 to 2019, nearly identical to his mid-career mark, places him 17th in all of baseball, indicating a relative decrease in groundball rate, which makes sense contextually, as league-wide flyballs have gone up since the advent of the so-called “launch angle revolution” that began a few seasons ago with Justin Turner, “Dodger Killer” Daniel Murphy and J.D. Martinez among others.

While the difference in groundball rate between his early career and mid-to-late career is marked at around 7%, what may be more notable is his consistency in creating ground balls even as they have decreased across the MLB. This demonstrates that the lefty hurler is having no trouble getting hitters to do what he wants them to do for the most part, which is to beat the ball into the ground for an out.

Less importantly to Kershaw’s groundball heavy game in recent years, but just as telling, are the changes and continuities in his flyball and line drive rates over the same stretches. While early on his career his flyball rate was 40.6% (32nd in baseball), from 2012-2016 his flyball rate was 30.7% (122nd in baseball) and from 2017-2019 his flyball rate has been 31.0% (63rd amongst qualified starters). This is a major decrease of nearly 10% from his early career to later career.

And yet, there seems to be little change between prime Kershaw and post-prime Kershaw in terms of groundball rate or flyball rate. Both seem to have stabilized in the 2012-2013 point in his career development and have remained mostly stagnant up until this point, despite noted decreases in velocity and despite changes in hitting as philosophy over this stretch.

What has this manifested itself as though in terms of results, mainly concerning differentiating prime from post-prime Kershaw? Put another way, if groundball rate and flyball rate have not changed over this stretch, why the disparity in ERA or FIP, or more simply in overall dominance?

SAN DIEGO, CALIFORNIA – MAY 03: Clayton Kershaw #22 of the Los Angeles Dodgers pitches during the first inning of a game against the San Diego Padres at PETCO Park on May 03, 2019 in San Diego, California. (Photo by Sean M. Haffey/Getty Images)
SAN DIEGO, CALIFORNIA – MAY 03: Clayton Kershaw #22 of the Los Angeles Dodgers pitches during the first inning of a game against the San Diego Padres at PETCO Park on May 03, 2019 in San Diego, California. (Photo by Sean M. Haffey/Getty Images) /

Strikeouts and Walks and Strikeouts vs. Walks

I felt like the best answer likely was a combination of strikeout rates, walk rates and the comparison between the two. Kershaw’s best seasons were also his best seasons in terms of raw strikeout and walk numbers and his K/BB ratio. From 2009-2011, Kershaw had the fifth-best K/9 amongst qualified starters at 9.51 with a BB/9 of 3.34, the 99th best mark amongst qualifiers.

His K/BB of 2.85, placing him right above aces Jon Lester and Max Scherzer, was good for 36th in baseball over this span thanks to a large number of strikeouts. But the contradiction between the high K rate and high BB rate meant that Kersh still had room to grow, and grow he did.

From 2012-2016, Kershaw had a 10.12 K/9 (6th in the MLB) and a 1.72 BB/9 (9th lowest in the MLB), which translated into a stellar 5.89 K/BB ratio, good for 2nd in all of baseball. This is the Kershaw we all grew to adore, the Kershaw with impeccable control and nasty stuff to boot, the Kershaw who in 2016 walked 11 while striking out 172, a historic margin.

Did this dominance of the strike zone continue into the 2017-2019 post-prime era? Is it what, at least in part, has kept him successful? From 2017-2019, Kershaw has posted a lower K/9 than both Rich Hil and Kenta Maeda, dropping down to 27th in baseball with a 9.32 K/9. In the walks department, Kershaw has remained elite, and in fact has further separated himself from the field, as his 1.58 BB/9 is the best mark in baseball over this span amongst qualified starters. Thus, Kershaw’s 5.89 K/BB from 2017-2019 is the exact same as his 2012-2016 mark.

So in summary, his strikeouts have remained relatively constant and his walks have actually improved in recent years. This for me rules out the idea that he has lost control and lost his stuff, at least in terms of the results. So what is causing Kershaw to fare worse in recent years than in the past?
LOS ANGELES, CALIFORNIA – APRIL 15: Clayton Kershaw #42 of the Los Angeles Dodgers pitches in his first game of the 2019 regular season against the Cincinnati Reds during the sixth inning on Jackie Robinson Day at Dodger Stadium on April 15, 2019 in Los Angeles, California. All players are wearing the number 42 in honor of Jackie Robinson Day. (Photo by Harry How/Getty Images)
LOS ANGELES, CALIFORNIA – APRIL 15: Clayton Kershaw #42 of the Los Angeles Dodgers pitches in his first game of the 2019 regular season against the Cincinnati Reds during the sixth inning on Jackie Robinson Day at Dodger Stadium on April 15, 2019 in Los Angeles, California. All players are wearing the number 42 in honor of Jackie Robinson Day. (Photo by Harry How/Getty Images) /

(The Best Explanation) Velocity, Contact Rates, and HR/FB

For the final potential explanation, I decided to turn to contact numbers and to compare them era vs. era vs. era with his velocity and pitch value scores. I was hopeful that this would determine whether or not Kershaw’s stuff has gotten worse, and if consequentially he has given up more hard contact and more home runs.

First, let’s compare his velocity across time, just to prove the precipitous decline the media has pushed for the past two seasons. From 2009 to 2011, Kershaw averaged 93.97 mph on his fastball according to Pitch Info across three seasons; from 2012 to 2016, he averaged 93.78 mph; from 2017 to 2019 he averaged 91.6 mph. The real dip, as noted by observers around the league, came in 2018 and thus far in 2019, with a drop from 93 mph in 2017 down to 91.4 mph and 90.4 mph in 2018 and 2019.

So yes, his velocity has dipped.

Now let’s see if his contact allowed has changed. We already know he does not give up more flyballs or groundballs now than he did between 2012-2016, so now I wanted to look into if he is giving up more hard contact or is inducing less soft contact. From 2009-2011, Kershaw gave up the third-least hard contact in the league, checking in at 22.6% behind on Jon Lester and Roy Halladay. From 2012-2016, he was 12th best at 26.4%.

Interestingly enough, from 2017-2019, Kershaw gave up 33.1% hard contact, placing him 32nd in all of baseball. Thus, over time he increased the amount of hard contact he has given up by around 4% per each passing era, even though velocity has not decreased over each era.

So we know that his velocity has dipped, but that it also is not the sole cause of his increase in hard contact allowed. We also know that hard contact rate around the league has increased as each era has passed. From 2017-2019, Dallas Keuchel led the league in suppressing hard contact with a 26.8% rate, a percentage similar to Kershaw’s 12th-best mark in the 2012-2016 era, demonstrating how hard contact, in general, has become harder to come by.

Thus, it seems that as Kershaw has aged, he has given up more hard contact, both in terms of raw numbers and in terms of relative to the league context.

So what now? Let’s check out another contact value, HR/FB rate. From 2009-2011, Kershaw led the league with a 5.7% HR/FB rate and from 2012-2016, Kershaw was tied for the best mark in baseball with a 7.6% HR/FB rate. From 2017-2019, Kershaw has the 62nd best HR/FB rate at 14.5%, sandwiching him between James Shields and Mike Leake, two pitchers notorious for giving up home runs over this span.

More from Clayton Kershaw

From 2012-2016, this 14.5% figure would have ranked Kershaw 7th-worst out of all qualified starters and from 2009-2011 this mark would have been tied for the worst in the league. This goes to show the real problem with the new look Kershaw: the league-wide home run surge has affected his game more than it has others, bloating his ERA despite his improved walk rate and his consistent strikeout rate.

In conclusion, Kershaw has given up more hard contact, and consequently more home runs per fly ball, in the last three seasons than he had at any point in his career, both in the contexts of raw numbers and the league in general. Despite allowing a similar contact profile in terms of groundballs and flyballs, the flyballs he now allows are being hit harder and for home runs more often than at any point in the previous decade of Kershaw dominance.

If there is a way for Kershaw to workaround this flaw, it has been to strike out lots of hitters and walk fewer, something he has been able to keep consistent from his 2012-2016 run as an ace up until today.

Next. CT3 stepping up in Corey Seager's absence. dark

If Kershaw can find a way to limit the number of fly balls he allows or the amount of hard contact he serves up (which is more difficult), potentially through altering his pitch mix or by throwing lower in the zone by adding a sinker, or perhaps even by adding a two-seam fastball or a cutter to miss more barrels, we could see an even more sustainable return to “ace hood” than that which he is currently providing the Dodger faithful. But in general, the best way to dampen the effect of your HR/FB rate on your ERA is to decrease the number of flyballs you allow.

Next