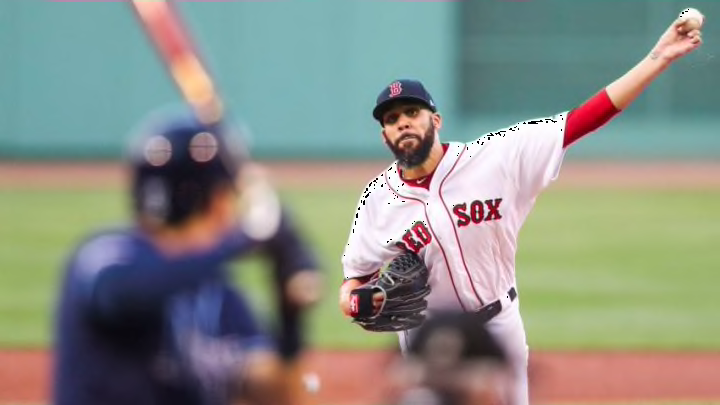
The David Price of the Present
Any pitcher that comes into town with an average annual salary of $31 million obviously does so with heavy expectations. For the most part, David Price met those expectations in the first year of his deal.
In 2016, the lefty made a career-high 35 starts and threw 230 innings in a Red Sox uniform. While his ERA climbed to 3.99 while making half of his starts in Fenway Park, he also went 17-9 and his ERA estimators like FIP and SIERA (both 3.60) thought better of his work. According to FanGraphs, Price was worth $35.2 million against his actual salary of $30 million in 2016, giving the Red Sox good value for their dollar in his first season.
Needless to say, there was some reason for optimism for better efforts in the years to follow.
The optimism faded quickly though in 2017, as injuries started to nip at Price’s heals a bit. Overall, he made just 16 appearances (11 starts) during his second season in Boston, and while the results were encouraging (3.38 ERA, 3.64 FIP, 135 ERA+), the lack of innings hurt the team and they ultimately received just $11.7 million in value from Price.
2018 was a tale of two seasons, Price went 16-7 during the regular season, with a 3.58 ERA. However, ERA estimators thought a bit less of his work, with FIP (4.02) and SIERA (3.82) grading lower and suggesting that Price was overachieving against how he was actually pitching. However, he turned it around in the postseason and helped the Red Sox capture the 2018 title while going 3-1 with a 3.46 ERA in the playoffs, including two wins in the World Series.
Things ended on a bit of a bittersweet note for Price in his Red Sox tenure. Repeated injuries curtailed his 2019 season, resulting in a rough season. In 22 starts, Price managed just 107.1 innings of a 4.28 ERA (his worst since his first full season as a starter).
| Year | Tm | W | L | ERA | IP | ERA+ | FIP | WHIP | H9 | HR9 | BB9 | SO9 | SO/W | Awards |
|---|---|---|---|---|---|---|---|---|---|---|---|---|---|---|
| 2016 | BOS | 17 | 9 | 3.99 | 230.0 | 112 | 3.60 | 1.204 | 8.9 | 1.2 | 2.0 | 8.9 | 4.56 | |
| 2017 | BOS | 6 | 3 | 3.38 | 74.2 | 135 | 3.64 | 1.192 | 7.8 | 1.0 | 2.9 | 9.2 | 3.17 | |
| 2018 | BOS | 16 | 7 | 3.58 | 176.0 | 123 | 4.02 | 1.142 | 7.7 | 1.3 | 2.6 | 9.1 | 3.54 | |
| 2019 | BOS | 7 | 5 | 4.28 | 107.1 | 113 | 3.62 | 1.314 | 9.1 | 1.3 | 2.7 | 10.7 | 4.00 | |
| 12 Y | 12 Y | 150 | 80 | 3.31 | 2029.2 | 123 | 3.35 | 1.153 | 8.0 | 0.9 | 2.3 | 8.8 | 3.76 | |
| 162 | 162 | 16 | 9 | 3.31 | 218 | 123 | 3.35 | 1.153 | 8.0 | 0.9 | 2.3 | 8.8 | 3.76 | |
| TBR | TBR | 82 | 47 | 3.18 | 1143.2 | 122 | 3.33 | 1.142 | 7.8 | 0.8 | 2.4 | 8.4 | 3.45 | |
| BOS | BOS | 46 | 24 | 3.84 | 588.0 | 118 | 3.74 | 1.204 | 8.4 | 1.2 | 2.4 | 9.3 | 3.90 | |
| DET | DET | 13 | 8 | 2.90 | 223.2 | 136 | 2.84 | 1.122 | 8.3 | 0.7 | 1.8 | 8.9 | 5.00 | |
| TOR | TOR | 9 | 1 | 2.30 | 74.1 | 179 | 2.22 | 1.009 | 6.9 | 0.5 | 2.2 | 10.5 | 4.83 |
Overall, David Price spent four seasons in a Red Sox uniform and won a World Series. However, he won just 46 games during his tenure, and contributed a 3.84 ERA, a 3.74 FIP, and an ERA+ of 118 over 588 innings in Boston. Value-wise, the Red Sox spent $169 million on David Price (including the $48 million sent to the Dodgers over the next three seasons) but saw only $85 million of the value returned according to FanGraphs.
